


A Pod is running slower than it should, or it just got killed, and you need to know why before you can fix it. Kubernetes exposes three different kinds of metrics that can tell you where the problem is coming from.
Resource metrics tell you how much CPU and memory something is using. State metrics tell you the status of objects, Pods, Deployments, Nodes, independent of resource usage. Control plane metrics tell you how the cluster's own decision-making components, the API server, the scheduler, are performing.
This guide covers where each kind comes from, what's worth tracking, the tools that collect them, Metrics Server and Prometheus, and how to view them, from a quick kubectl top to autoscaling and real troubleshooting.
What Kubernetes metrics are and where they come from
The three categories of Kubernetes metrics
Kubernetes produces three distinct kinds of metrics, and mixing them up is the most common reason a metrics setup looks complete but still can't answer a real question.
Resource metrics measure what a Pod or Node is actually consuming, CPU reported in cores and memory reported as the working set in bytes, not total allocated memory. These are the numbers kubectl top shows and the Horizontal Pod Autoscaler scales against.
State metrics describe the status of Kubernetes objects rather than their resource usage, how many replicas a Deployment has ready, whether a Pod is pending, how many times a container restarted. The API server tracks this state already; kube-state-metrics is what turns it into a feed something like Prometheus can scrape.
Control plane metrics cover the cluster's own decision-making machinery, API server request latency, scheduler binding latency, etcd disk sync duration. These matter less for day-to-day app troubleshooting and more for whether the cluster itself is healthy at scale.
Each category answers a different question:
- Is my app using too much?
- Is my app in the state I expect?
- Is the cluster itself keeping up?
Most dashboards end up needing all three.
The metrics pipeline
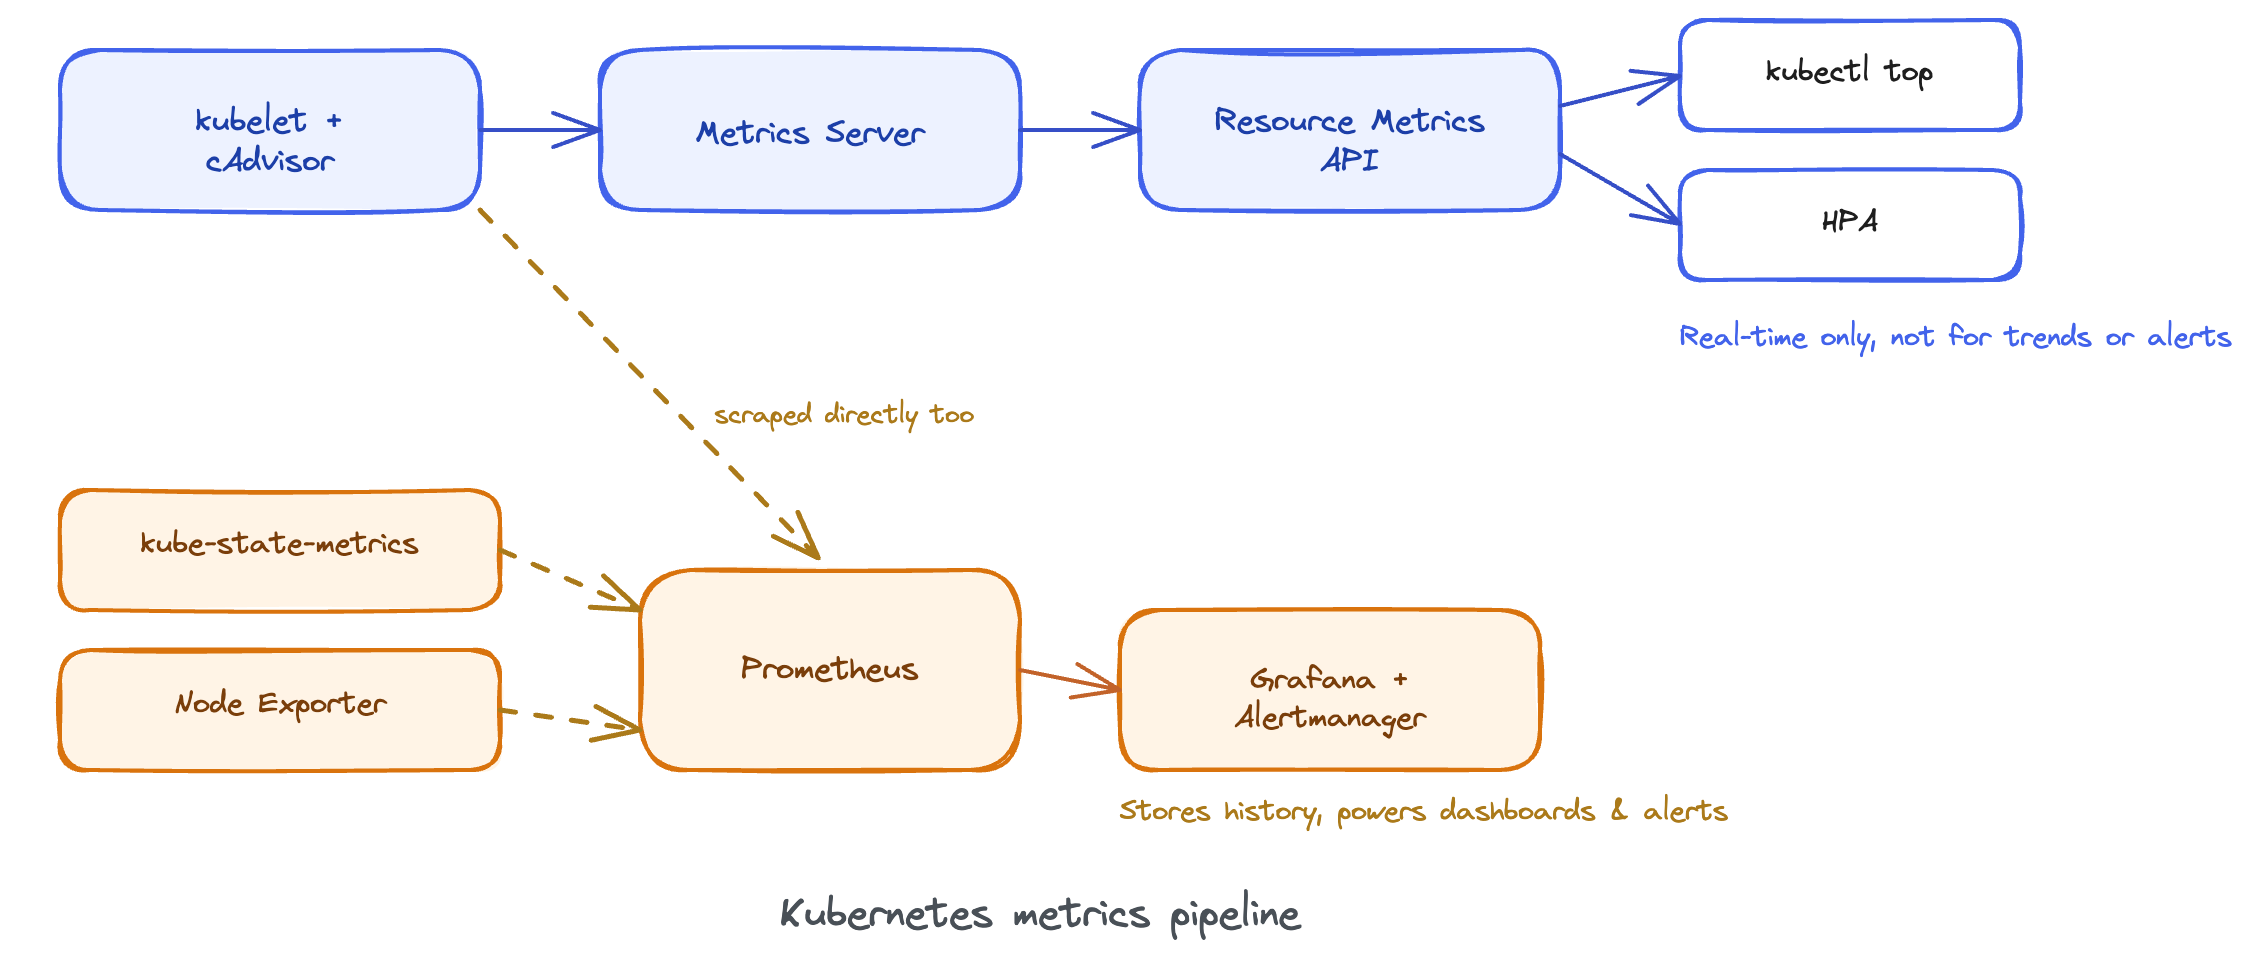
Container metrics start with cAdvisor, which runs embedded inside every kubelet and collects CPU, memory, filesystem, and network usage per container. The kubelet exposes that data on its own Summary API.
Metrics Server polls every kubelet's Summary API on a fixed interval, aggregates the results, and holds them in memory. It doesn't store history, only the most recent reading per resource.
Metrics Server then exposes what it holds through the Resource Metrics API, served at metrics.k8s.io. kubectl top nodes and kubectl top pods query that API directly, and so does the Horizontal Pod Autoscaler when it decides whether to scale.
The whole pipeline runs in four steps: kubelet and cAdvisor collect, Metrics Server aggregates, the Resource Metrics API exposes, HPA and kubectl top consume. It stays fast by skipping anything that pipeline doesn't need, which is also its biggest limitation. Metrics Server keeps no history. Restart it and every number resets, with no way to query what usage looked like three hours ago or get alerted on a threshold.
Prometheus keeps the usage history Metrics Server throws away. Almost every real cluster runs both, Metrics Server for the fast path autoscaling needs right now, Prometheus for everything that needs to be remembered.
The Kubernetes metrics list: what to actually track
Some of these numbers matter far more than others, and a handful of them will diagnose most problems on their own.
Node and pod metrics
On a Node, the numbers that matter are allocatable CPU and memory versus what's actually in use. The gap between them tells you whether a Node is genuinely full or just poorly packed.
On a Pod, memory working set matters more than RSS, since working set is what the kubelet compares against limits when deciding whether to OOM-kill a container. Two metrics matter most:
- Pod restart count. A climbing restart count means something is crash-looping, and it's usually the fastest signal that a deploy or a config change broke something
- Container CPU throttle ratio. The share of time a container spent throttled against its CPU limit. A Pod that never restarts can still be slow because it's constantly hitting its CPU limit, and throttling alone won't show up in a restart count or an OOMKill event
Round those out with OOMKill events themselves, visible in kubectl describe pod, which confirm the cause was memory rather than a crash.
Cluster and control plane metrics
At the cluster level, check Node readiness first. A Node flipping between Ready and NotReady repeatedly usually points to a kubelet, networking, or resource problem on that specific machine, not the workloads running on it.
API server request rate and latency show whether the cluster's control plane is keeping up under load. etcd disk sync duration and leader election frequency matter because etcd holds every object's state, and a slow disk there makes the whole API server feel slow even though etcd is the real bottleneck. Scheduler binding latency, how long a Pod takes to go from unscheduled to assigned, is the metric to check when Pods are stuck Pending for no obvious reason.
These matter less for day-to-day app debugging and more for whether the cluster can be trusted at scale. A team running a handful of Pods rarely needs to watch etcd latency; a team running thousands does.
Application and custom metrics
Applications can expose their own metrics, request counts, queue depth, cache hit rate, on a /metrics endpoint. The Prometheus Adapter turns those into Kubernetes-native metrics through custom.metrics.k8s.io, the same way Metrics Server exposes resource metrics through metrics.k8s.io. HPA can then scale on a custom metric, like queue depth, the same way it scales on CPU.
Ten of the metrics covered above come up often enough to be worth a quick reference:
Collecting metrics: Metrics Server vs Prometheus
Two tools cover almost every cluster's metrics setup, and they solve different problems.
Metrics Server
Metrics Server is the component that makes that pipeline work, a single, lightweight deployment polling kubelets and serving the result through the Resource Metrics API.
Installing it is one command:
Most managed Kubernetes platforms, Rackspace Spot included, ship it by default, so this step is often already done before a cluster is handed to a team.
Metrics Server exists to power exactly two things, kubectl top and HPA's resource-based scaling decisions. It isn't a monitoring system, and it doesn't store history or alert on anything. A team that only needs autoscaling and an occasional kubectl top doesn't need anything more than this.
Metrics Server's simplicity is also its ceiling. Anything beyond fast, current-state resource numbers means bringing in Prometheus.
Prometheus and the exporters
Prometheus is the de facto standard for everything Metrics Server doesn't do, long-term storage, alerting, dashboards, and queries across history. It scrapes metrics endpoints on a schedule and stores every sample in its own time-series database.
Prometheus doesn't collect Kubernetes metrics on its own. It scrapes exporters that expose them:
- kube-state-metrics exposes the state metrics covered earlier, replica counts, Pod phase, restart counts
- Node Exporter exposes host-level metrics from the underlying machine, disk, network, host CPU, outside what Kubernetes itself tracks
- cAdvisor exposes the same per-container resource metrics Metrics Server uses, but Prometheus scrapes it directly and keeps the history Metrics Server throws away
Installing all of this piece by piece is more setup than most teams want. The kube-prometheus-stack Helm chart bundles Prometheus, Grafana, Alertmanager, and the exporters above into one install, which is why it's become the default way most teams run this stack.
Which one do you need
Reach for Metrics Server when the only requirement is autoscaling or a quick kubectl top. Reach for Prometheus when the requirement is history, alerting, or a dashboard, anything answering "what happened" rather than "what's happening right now."
In practice, most production clusters run both: Metrics Server for the fast path HPA needs, Prometheus for everything queried, graphed, or alerted on later.
Using metrics: autoscaling, viewing, and troubleshooting
Collecting metrics only matters if they change what you do next.
How to view Kubernetes metrics
The fastest way to check current resource usage is kubectl top:
Both commands read straight from the Resource Metrics API, so they only work once Metrics Server is installed and only show the most recent snapshot.
For scripting, kubectl get --raw against metrics.k8s.io returns the same data as JSON. For history and trends, Grafana querying Prometheus is the standard, since neither kubectl top nor the raw Metrics API can show anything that already happened.
Viewing metrics manually is useful for incidents. The bigger value comes from acting on them automatically, which is what autoscaling does.
Metrics that drive autoscaling
The Horizontal Pod Autoscaler reads directly from the Resource Metrics API, comparing current CPU or memory usage against a target, and adds or removes Pod replicas to hit it. It can also scale on a custom metric, like queue depth, through the custom.metrics.k8s.io API described earlier.
apiVersion: autoscaling/v2
kind: HorizontalPodAutoscaler
metadata:
  name: api-hpa
spec:
  scaleTargetRef:
    apiVersion: apps/v1
    kind: Deployment
    name: api
  minReplicas: 2
  maxReplicas: 10
  metrics:
  - type: Resource
    resource:
      name: cpu
      target:
        type: Utilization
        averageUtilization: 70
HPA almost always targets a Deployment directly, the way scaleTargetRef does in the manifest above.
One trap catches almost every team eventually. HPA computes utilization against a Pod's request, not its actual limit or real-world need. Set the CPU request too high and a Pod can sit mostly idle while still reading as under target, so autoscaling that looks fine quietly never triggers.
The Vertical Pod Autoscaler solves a different problem, adjusting a Pod's own requests over time from historical usage instead of adding replicas. HPA and VPA can run together, but only on different metrics; having both adjust CPU at once creates a fight neither wins.
Autoscaling handles the automatic response. When something still goes wrong despite it, the same metrics are also the fastest way to diagnose why.
Troubleshooting with metrics
Three specific diagnoses cover most real incidents:
- OOMKilled containers. Check working set against the memory limit. A container hitting its limit right before a restart, visible in
kubectl describe podasOOMKilled, confirms the cause instead of leaving it as a guess - Throttled but not crashing. A Pod that's slow but never restarts is often hitting its CPU limit. Throttle ratio confirms it directly, since usage alone can look perfectly normal on a throttled container
- Pods stuck Pending. Scheduler queue metrics and binding latency show whether the scheduler is struggling to place Pods, versus a Pod simply waiting on a resource request no Node can satisfy
In each case, the metric doesn't just flag that something is wrong. It points at which of a handful of causes it actually is.
Why choose Rackspace Spot for Kubernetes?
Rackspace Spot offers Kubernetes clusters for as little as $0.72 a month, the cheapest managed Kubernetes compute available today.
- Fully managed Kubernetes Cloudspaces with a built-in autoscaler, with Calico and Cilium available as CNI options
- Open-market auction pricing, with bids starting at $0.001/hr for a server, about $0.72/month, and prices set by real supply and demand, plus a free, fully managed control plane on every cluster
- Rackspace Spot's DBaaS product for teams that need managed PostgreSQL running alongside their cluster
- Terraform provider support, alongside the spotctl CLI, for managing cloudspaces as code across dev, staging, and production
- Persistent Volumes across SATA, SSD, and NVMe storage classes, starting at $0.02/GB-month
- Load balancers at a flat $10/month with no per-traffic charges
One limitation applies here: DBaaS currently supports only managed PostgreSQL, while AWS, GCP, and Azure each offer a broader range of database engines. Teams already standardized on PostgreSQL won't notice; a team running MySQL or a document store has to run that database outside the platform.
Get started with Rackspace Spot and deploy a cluster with the components covered in this guide.
Frequently asked questions
What are Kubernetes metrics?
Kubernetes metrics are numerical measurements of how a cluster and the workloads on it are behaving, split into three kinds: resource metrics (CPU and memory usage), state metrics (the status of objects like Pods and Deployments), and control plane metrics (how the API server, scheduler, and etcd are performing).
What are the three types of metrics?
Resource metrics measure actual CPU and memory usage. State metrics, exposed through kube-state-metrics, describe object status like replica counts and restarts. Control plane metrics cover the health of the API server, scheduler, and etcd. Some sources split resource metrics into CPU and memory as separate categories, but three is the standard framing.
How do I view Kubernetes metrics?
Run kubectl top nodes or kubectl top pods for a live snapshot; both read from the Resource Metrics API and require Metrics Server installed. For raw JSON, query metrics.k8s.io directly with kubectl get --raw. For history, trends, and dashboards, Prometheus paired with Grafana is the standard approach, since neither kubectl top nor the raw API stores anything beyond the current reading.
What are the key differences between Metrics Server and Prometheus?
Metrics Server is lightweight, keeps only the most recent reading, and exists specifically to power kubectl top and the Horizontal Pod Autoscaler. Prometheus stores history, supports alerting and arbitrary queries, and needs exporters like kube-state-metrics and Node Exporter to see anything beyond raw resource numbers. Most production clusters run both rather than choosing one.
What are the best practices for metrics in Kubernetes?
Set CPU and memory requests close to real usage, since inflated requests suppress HPA scaling. Track restart count and CPU throttle ratio as the fastest crash and slowness signals. Run Metrics Server for autoscaling and Prometheus for history and alerting. Most clusters need both.
Is there a GUI for Kubernetes?
The Kubernetes Dashboard used to be the answer, but it's now archived. Kubernetes recommends Headlamp as its replacement, an official Kubernetes SIG UI project that shows cluster resources and basic metrics if Metrics Server is installed, plus multi-cluster support and plugins. For metrics history specifically, Grafana on top of Prometheus remains the more common choice.
Is Kubernetes still relevant in 2026?
Yes. Kubernetes remains the standard for running containerized workloads at scale, and every major cloud, including managed platforms like Rackspace Spot, builds around it rather than replacing it. What's changed is maturity: fewer teams run it by hand, and more run it through a managed control plane while focusing on the workloads instead of the cluster itself.