


Kibana is the web interface for the Elastic Stack, providing a visual way to explore Elasticsearch data, build dashboards, monitor deployments, and manage the cluster.
There has long been some confusion around the credentials used to log in to Kibana, particularly when it is deployed on Kubernetes. Is the username elastic, kibana_system, or something else? And what is the default password?
Here is the short version: the default Kibana login username is elastic. There is no fixed password. Kubernetes generates one per deployment and stores it in a Secret, so the task is retrieval, not memorization.
In this walkthrough, we’ll clarify how Kibana’s built-in users work and show how to retrieve or reset your login credentials on Kubernetes. We’ll use a Kubernetes cluster running on Rackspace Spot as our test environment, so you can follow the same steps on a live cluster.
The short answer: Kibana's default username on Kubernetes
The default Kibana username on Kubernetes is elastic, the built-in superuser account for the Elastic Stack. Use it to log in to the Kibana UI and to perform initial administration.
A separate account, kibana_system, exists alongside it. Kibana uses kibana_system internally to connect to Elasticsearch. It is a service account, not a login. Confusing the two is the single most common cause of failed Kibana logins on Kubernetes.
No fixed default password exists. Modern Elasticsearch and Kibana (v8 and later) auto-generate the elastic password at deployment time and store it in a Kubernetes Secret. Retrieve it with a kubectl command instead of looking it up in documentation.
Kibana's built-in users explained
The Elastic Stack ships with six built-in users. Each one has a specific purpose, and only one of them logs in to the Kibana UI.
elastic: the superuser. Full cluster access, including the.securityindex. Log in with this account for initial setup and administrative tasks.kibana_system: Kibana's service account for connecting to Elasticsearch. Never log in with it.logstash_system: Logstash uses this account to write monitoring data to Elasticsearch.beats_system: Filebeat, Metricbeat, and the other Beats use this account for the same purpose.apm_system: the APM Server uses this account to store monitoring data.remote_monitoring_user: Metricbeat uses this account specifically for remote monitoring collection.
Only elastic is meant for interactive login. The other five authenticate applications to Elasticsearch, not people to Kibana.
Is elastic the same as kibana_system?
No. A manual Kibana Deployment makes the distinction concrete: kibana_system gets set as the ELASTICSEARCH_USERNAME environment variable so Kibana can authenticate its own backend calls to Elasticsearch, while a human logging in to the UI, or a script calling the API, authenticates as elastic. The two accounts never substitute for each other.
Why there's no fixed default password
On paper, older Elastic Stack guides describe a simple default: install X-Pack, log in with changeme, done. But that default was removed years ago, and applying it to a current Kubernetes deployment produces a login failure, not a login.
Three answers circulate for this keyword, and only one is correct on Kubernetes today:
- "changeme": the legacy pre-v8 default, still referenced in old forum threads. Not valid on any current deployment.
- "admin": appears in at least one community answer as a guess. Not a real Elastic default in ECK or standard installs.
- "no default, auto-generated": the correct answer. Elasticsearch and Kibana v8+ generate the
elasticpassword at deployment and store it in a Kubernetes Secret. It differs on every cluster.
Elastic Cloud on Kubernetes, known as ECK, generates and stores this password automatically. A manual deployment requires setting the password explicitly when security is configured. Either way, the password lives in a Secret, not in a document.
Provision your cluster on Rackspace Spot
Everything above assumes Kibana is already running somewhere. If it is not, Rackspace Spot can provision the Kubernetes cluster first, before ECK or Helm ever touches it.
Prerequisites:
2. spotctl installed if you plan to manage the cluster from the terminal (see the spotctl deployment guide).
3. If you decide to provision the cluster with Terraform, the major steps are:
- Generate a Terraform API token from the Rackspace Spot dashboard (API Access > Terraform).
- Use that token to authenticate the Rackspace Spot Terraform provider.
- Declare the cloudspace and node pool resources, then run
terraform initandterraform apply.
The token generation screen and the full walkthrough, including how to store the token securely, are documented at Deploy your cloudspace via Terraform.
Follow it end to end, then return here once kubectl can reach the new cluster.
Here is what a provisioned cloudspace looks like on the Rackspace Spot dashboard, including its running cost:
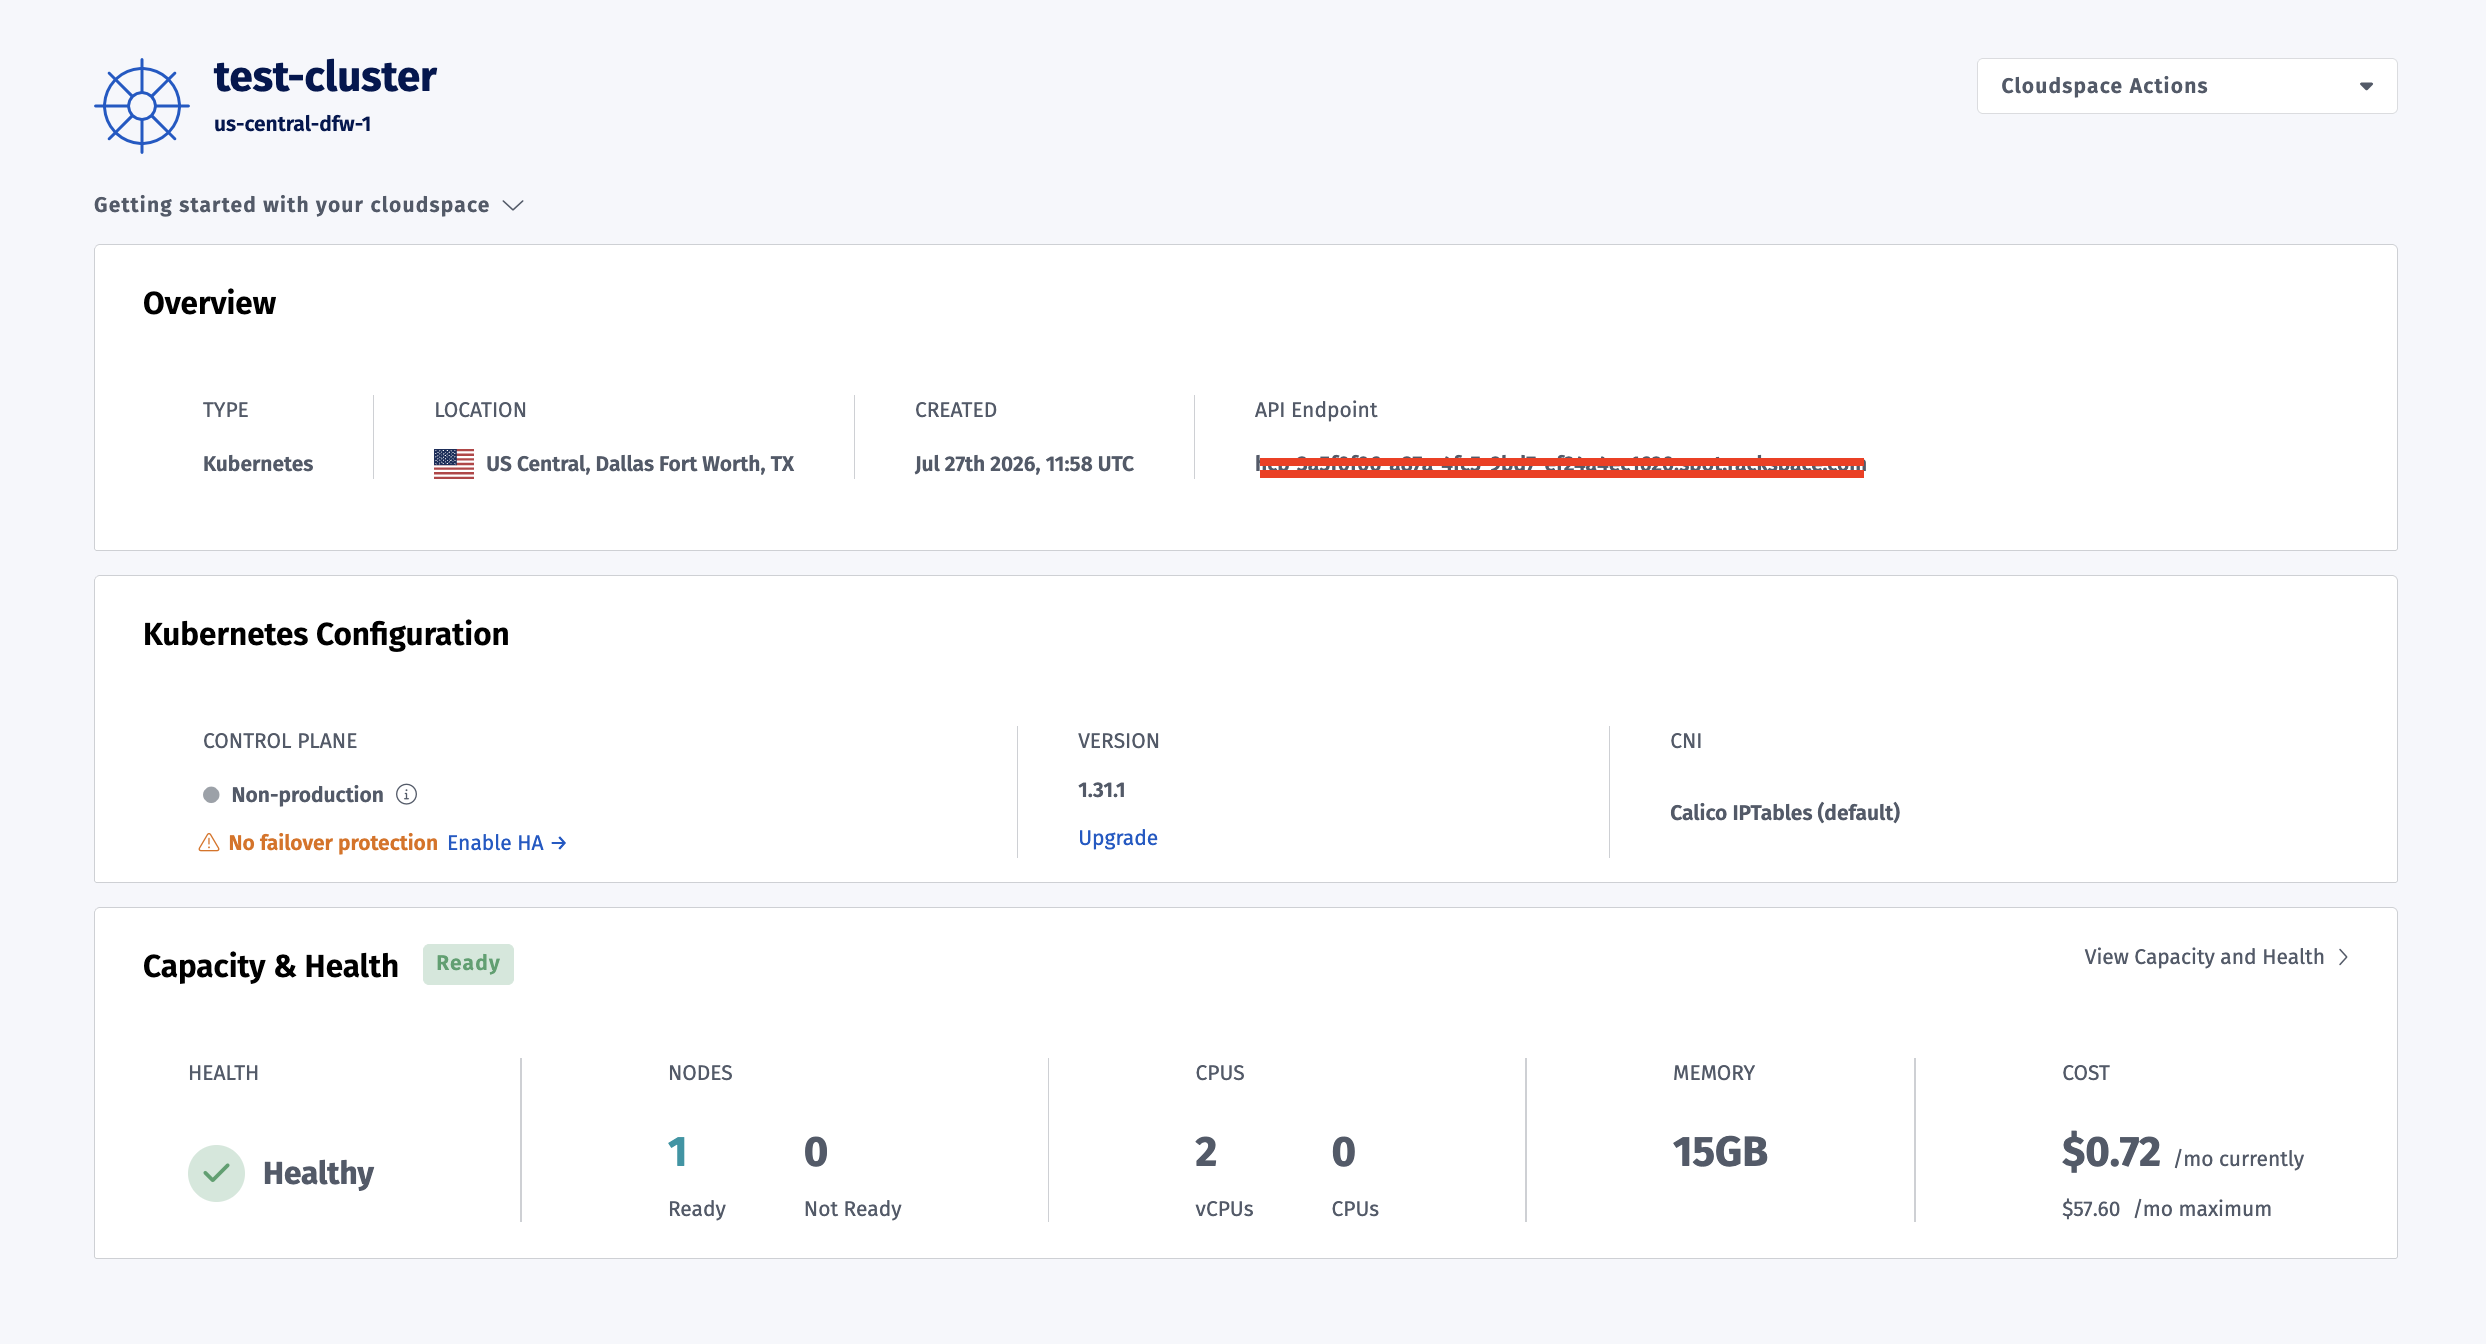
Rackspace Spot cloudspace dashboard for test-cluster, showing a healthy status, 1 ready node, 2 vCPUs, 15GB memory, and a running cost of $0.72 per month.
How to retrieve or reset Kibana credentials in Kubernetes
The credential story differs by how Kibana got deployed. These are the three ways teams actually run it on Kubernetes.
Method 1: ECK operator (recommended)
ECK auto-generates the elastic password into a Secret named:
<cluster-name>-es-elastic-userRetrieve it:
kubectl get secret elasticsearch-es-elastic-user \ -o=jsonpath='{.data.elastic}' -n <namespace> | base64 --decode; echoElastic recommends ECK over Helm for new deployments. It manages the full lifecycle through Kubernetes custom resources instead of static charts.
Method 2: Raw manifests or a plain Deployment
With a hand-written Deployment, there is no password to look up.
You create the Secret yourself, holding the kibana_system password, and wire it into Kibana through ELASTICSEARCH_PASSWORD or elasticsearch.password in kibana.yml.
The elastic password is whatever was set when security was first configured on the cluster, stored wherever your team decided to store it.
Method 3: Helm charts (legacy standalone charts, deprecated)
Elastic's original standalone Helm charts (elastic/helm-charts, deploying Elasticsearch and Kibana directly as StatefulSets, with no ECK involved) were archived on May 16, 2023. Elastic's own guidance from that point on: use ECK, and treat the old charts as community-maintained rather than vendor-supported. A guide built on that older chart lineage is working against something the vendor stopped actively maintaining years ago.
Helm itself is not dead for the Elastic Stack, though. Elastic now publishes and actively maintains a different set of charts, eck-stack, eck-elasticsearch, and eck-kibana, hosted at helm.elastic.co. Those install and configure ECK's own custom resources through Helm. The cluster still runs through the ECK operator underneath, so this path is a packaging convenience on top of Method 1, not a standalone alternative to it.
Access the Kibana UI locally
Whichever method produced it, the password only proves useful once it unlocks a login screen. Kibana listens on port 5601, and Elastic Stack v8 serves it over HTTPS by default:
Kibana listens on port 5601. Elastic Stack v8 serves it over HTTPS by default:
kubectl port-forward service/kibana-kb-http 5601 -n <namespace>Forwarding from 127.0.0.1:5601 -> 5601
Forwarding from [::1]:5601 -> 5601Open https://127.0.0.1:5601 and log in as elastic with the password retrieved above.

Create a custom user instead of using elastic
Elastic's own guidance is not to use the elastic superuser for daily work. Exec into an Elasticsearch pod and create a scoped user instead:
kubectl exec -it <es-pod-name> -n <namespace> -- /bin/bash./bin/elasticsearch-users useradd <username>./bin/elasticsearch-users roles <username> -a superuseruseradd and roles produce no output on success. Confirm the new account with ./bin/elasticsearch-users list:
demo-user      : superuser
elastic-internal-probe: elastic_internal_probe_user
elastic        : superuser
elastic-internal: superuser
elastic-internal-pre-stop: elastic-internal_cluster_manage
elastic-internal-diagnostics: elastic_internal_diagnostics_v85
elastic-internal-monitoring: remote_monitoring_collector
demo-user now appears with the superuser role alongside elastic. The other entries (elastic-internal*) are ECK's own internal service accounts, not something you create or use directly.
Assign a narrower role than superuser for anyone who only needs read access to dashboards.
Reset an existing password
Use the elasticsearch-reset-password tool to rotate the elastic password. kibana_system's password is set and updated separately, and referenced through elasticsearch.password in kibana.yml on the Kibana side.
Common Kibana login errors and how to fix them
- "Incorrect username or password," even though nothing was set: Kibana expects the Secret-stored
elasticpassword, not a blank field or a guessed value. Retrieve it with the command in Method 1 before trying again. - A custom user logs in but sees nothing, or gets "no permissions": the account has no role assigned. Attach one through
elasticsearch-users roles, or define read-only and admin roles through the security API or Kibana's role management screen. - Port-forward stops working mid-session: port 5601 may already be in use locally. Check with
lsof -i :5601or remap to a different local port. Thekubectl port-forwardprocess must keep running in the foreground, or its own terminal, for the UI to stay reachable. - Credentials that worked yesterday fail today: Secrets can go stale after a pod restart if they were rotated outside of Kubernetes. Confirm the namespace is correct, then re-fetch the Secret directly rather than trusting a saved value.
- Kibana loads with no login screen at all: this usually means Kibana is exposed without authentication. Never run it that way in production. Add basic auth, OIDC, or SAML at the Ingress before exposing it beyond the cluster.
Kibana on Kubernetes: quick background
The Elastic Stack has four core components. Elasticsearch is the search engine and data store. Kibana is the web UI. Logstash is the ingest and transform pipeline. Beats are lightweight shippers, Filebeat for logs, Metricbeat for metrics, Auditbeat and Packetbeat for the rest. The stack is officially the Elastic Stack now, though "ELK Stack" persists in casual use, and "EFK" describes the common variant where Fluentd or Fluent Bit replaces Logstash for ingestion.
Three deployment paths exist on Kubernetes today: the ECK operator (install the CRDs, install the operator, then declare Elasticsearch and Kibana custom resources), raw manifests with a plain Deployment, or the older Helm charts that Elastic no longer maintains.
By default, Kibana runs on port 5601, reached in-cluster, through kubectl port-forward, or through an Ingress or load balancer for external access. Elastic Stack v8 enforces TLS by default, which is why the local URL in this guide uses https://, not http://.
Securing and authenticating Kibana access (optional, advanced)
Getting the first login working is step one. Production access control is a separate, deeper problem, and the natural next question once the login screen stops blocking you.
At a high level, the options stack:
- Basic auth at the Ingress: an
htpasswdSecret plus nginx annotations, the simplest layer to add first. - Kibana's native basic provider: the built-in login screen already covered above.
- OAuth or OIDC: through an identity provider such as Keycloak.
- SAML: for enterprise single sign-on.
- RBAC: roles and spaces, separating read-only access from admin access.
- Network controls: IP whitelisting at the Ingress, or a Kubernetes NetworkPolicy restricting which pods can reach Kibana at all.
A production checklist worth running before Kibana goes live: TLS enabled everywhere, no unauthenticated access under any circumstance, RBAC applied, audit logging turned on, session timeouts set, multiple replicas for high availability, resource limits defined, and Kibana kept on a version that matches Elasticsearch.
Quick reference: built-in users, ports, and commands
Key ports: Kibana 5601, Elasticsearch 9200.
Key commands:
# Retrieve the elastic password (ECK)kubectl get secret elasticsearch-es-elastic-user \ -o=jsonpath='{.data.elastic}' -n <namespace> | base64 --decode; echo# Port-forward to the Kibana UIkubectl port-forward service/kibana-kb-http 5601 -n <namespace># Create a custom userkubectl exec -it <es-pod-name> -n <namespace> -- /bin/bash./bin/elasticsearch-users useradd <username>./bin/elasticsearch-users roles <username> -a superuserFrequently asked questions
What is the default Kibana password?
No fixed default Kibana password exists on Kubernetes. Elasticsearch and Kibana v8+ auto-generate the elastic user's password at deployment and store it in a Kubernetes Secret, retrievable with kubectl get secret.
How do I find my Kibana password in Kubernetes?
Run kubectl get secret elasticsearch-es-elastic-user -o=jsonpath='{.data.elastic}' -n <namespace> | base64 --decode against an ECK deployment. For a manual deployment, the password is whatever was configured when security was first set up.
Can I set a custom Kibana username and password?
Yes. Exec into an Elasticsearch pod and run elasticsearch-users useradd <username>, then assign a role with elasticsearch-users roles <username> -a superuser or a narrower role. Elastic recommends this over routine use of elastic.
Is "elastic" the same as "kibana_system"?
No. elastic is the interactive superuser for logging in to Kibana. kibana_system is a service account Kibana uses internally to authenticate to Elasticsearch. Only elastic is meant for human login.
What is the default username for Kibana?
elastic. It is the only built-in user intended for logging in to the Kibana UI.
What is Kibana in Kubernetes?
Kibana is the web UI component of the Elastic Stack, typically deployed on Kubernetes alongside Elasticsearch through the ECK operator, raw manifests, or, less commonly now, Helm charts.
What is the default address of Kibana?
Port 5601. Reach it in-cluster, through kubectl port-forward, or externally through an Ingress or load balancer.
What is the username of Kibana Docker?
The same elastic superuser applies in a standalone Docker deployment as it does on Kubernetes. Older Docker images referenced a static changeme password; current images generate one at startup or require it to be set explicitly through environment variables.
You can run Kibana by getting started on Rackspace Spot, which offers the cheapest prices for instances. Check out the pricing page and sign up to get started.